The Stoppage Time That Never Gets Played
If stoppage time were measured correctly, 21% of matches would finish with a different scoreline, and 11% with a different result.

Stoppage time is a sham.
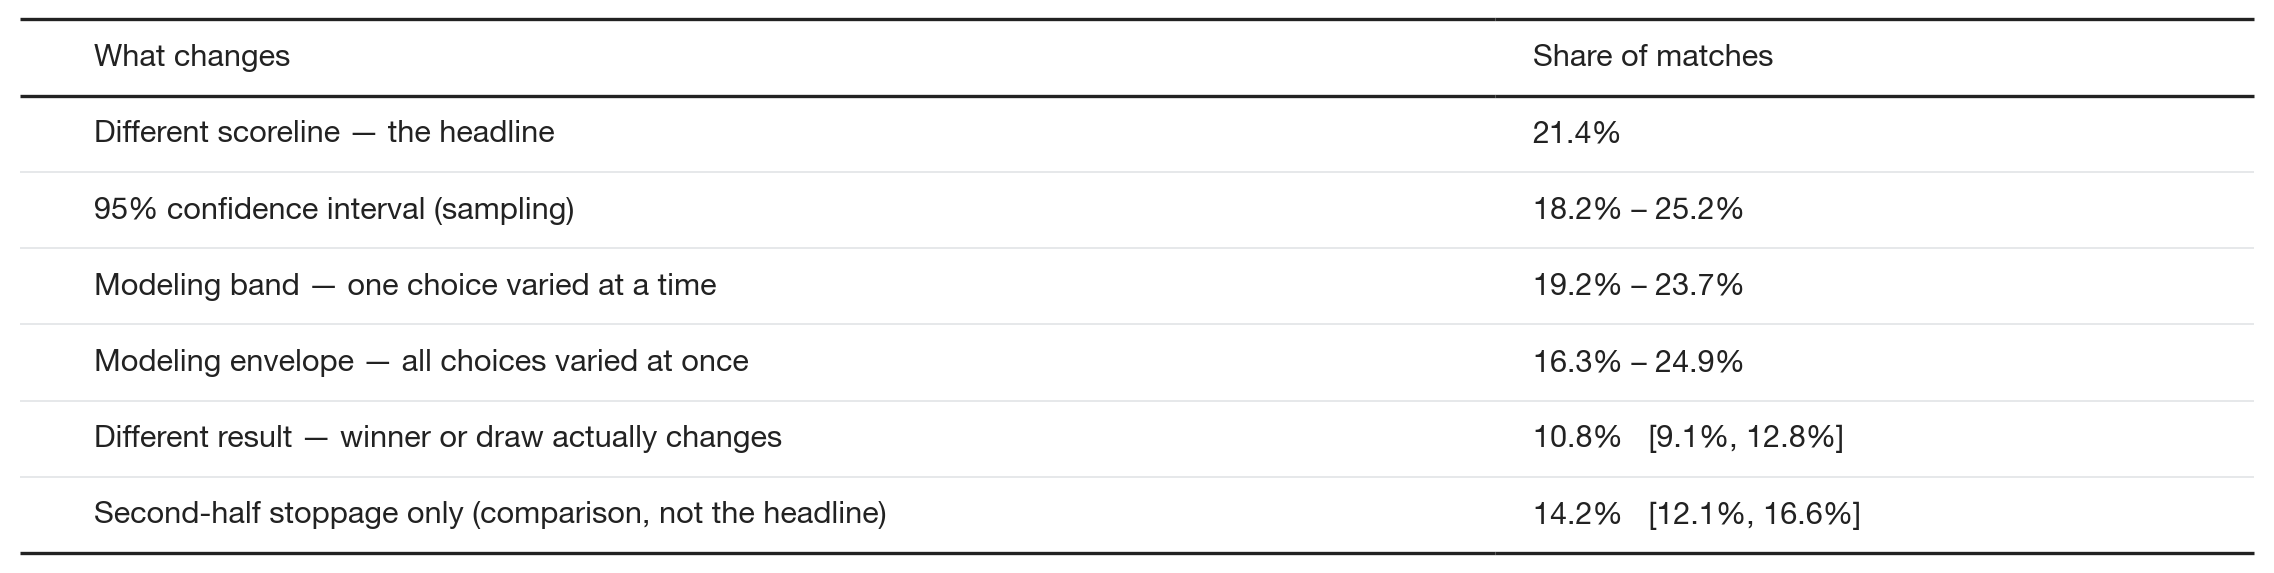
If stoppage time were measured correctly, I estimate that 21.4% of matches in the last six major international tournaments would have finished with a different scoreline [95% CI: 18.2%, 25.2%] — and 10.8% with a different result [9.1%, 12.8%] (World Cups ‘18 & ‘22, Euros ‘20 & ‘24, Copa ‘24, AFCON ‘23).
Why I built the model
The motivation for this model comes from two observations about football matches:
1. Stoppage time is systematically under-awarded. During the 2018 World Cup, Nate Silver hand-measured every match in the group stage and found that referees under-award stoppage time in 97% of matches, by an average of 6 minutes. I pulled the stoppage time data across five major tournaments since. The direction and magnitude of error is striking; 98% of matches ended too early, by an average of 7 minutes.
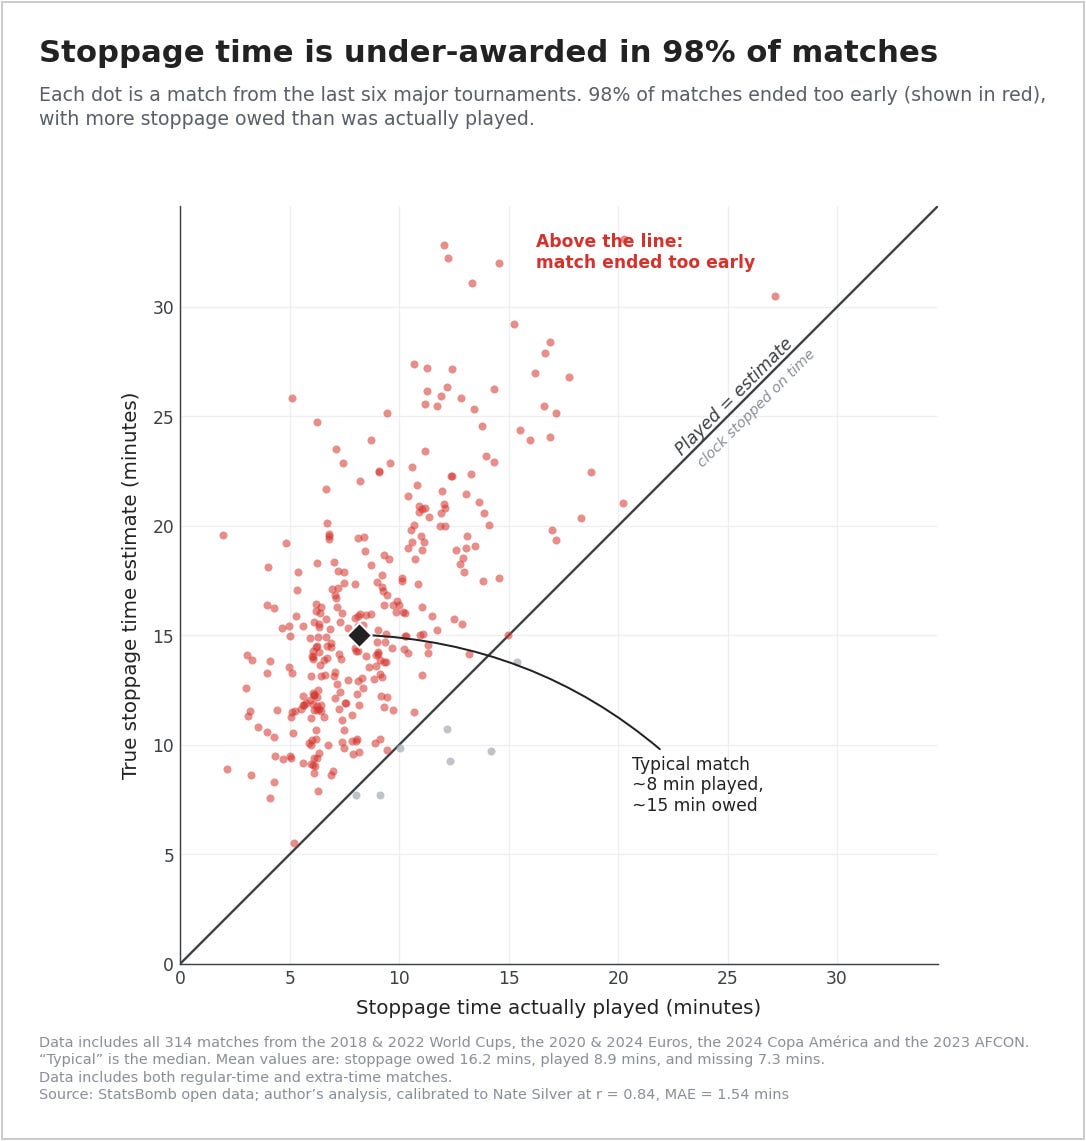
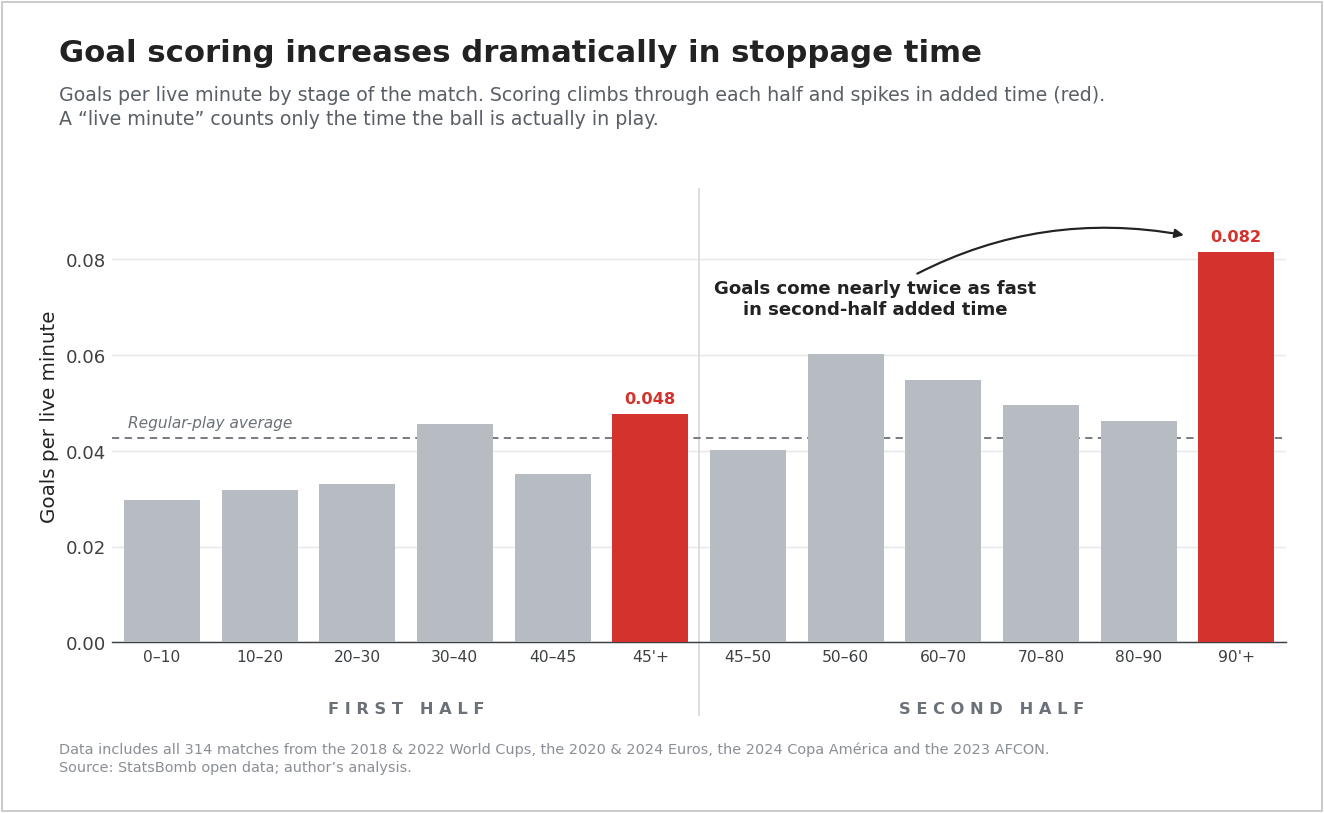
2. Teams are much more productive during stoppage time. The goal-scoring rate in 2nd half stoppage time is 1.9× the average minute.
The data
All of the match data in this project comes from StatsBomb, one of the sport’s gold-standard providers. StatsBomb codes each match into a timestamped log of on-ball events: pass, shot, tackle, etc. Each match carries roughly 3,000+ logged events, over 30 per minute. The coding is done by a combination of computer vision and human intervention. Professional clubs buy this data to analyze opponents, among them Club Brugge. Since 2018, StatsBomb has released part of that professional database free for research. This project runs entirely on the free release. I use all 314 match logs from the last six major international tournaments.
I also use World Football Elo rankings to stress-test the model by factoring in team quality (see Objection #5).
Methodology
The core idea is simple. Take all 314 matches as played. For each, append the stoppage the referee should have added but didn’t, and ask: what’s the probability of a goal in the appended minutes? Average that probability across the 314 matches. That average is the headline.
Step 1 — Measure stoppage played and stoppage owed, and validate against Nate Silver’s data. First, stoppage owed. The Laws of the Game (Law 7) tell the referee to add all time lost to substitutions, injuries, celebrations, cards, VAR checks, and time-wasting. But there is no stated limit on how long a routine throw-in or goal kick may take before the delay counts as lost time. To measure owed stoppage, you have to supply the thresholds the Laws omit. Nate Silver’s 2018 stopwatch study supplied them, and I adopt his table unchanged. (His allowances are generous. For example, a throw in gets 20 seconds before any of it counts as owed):
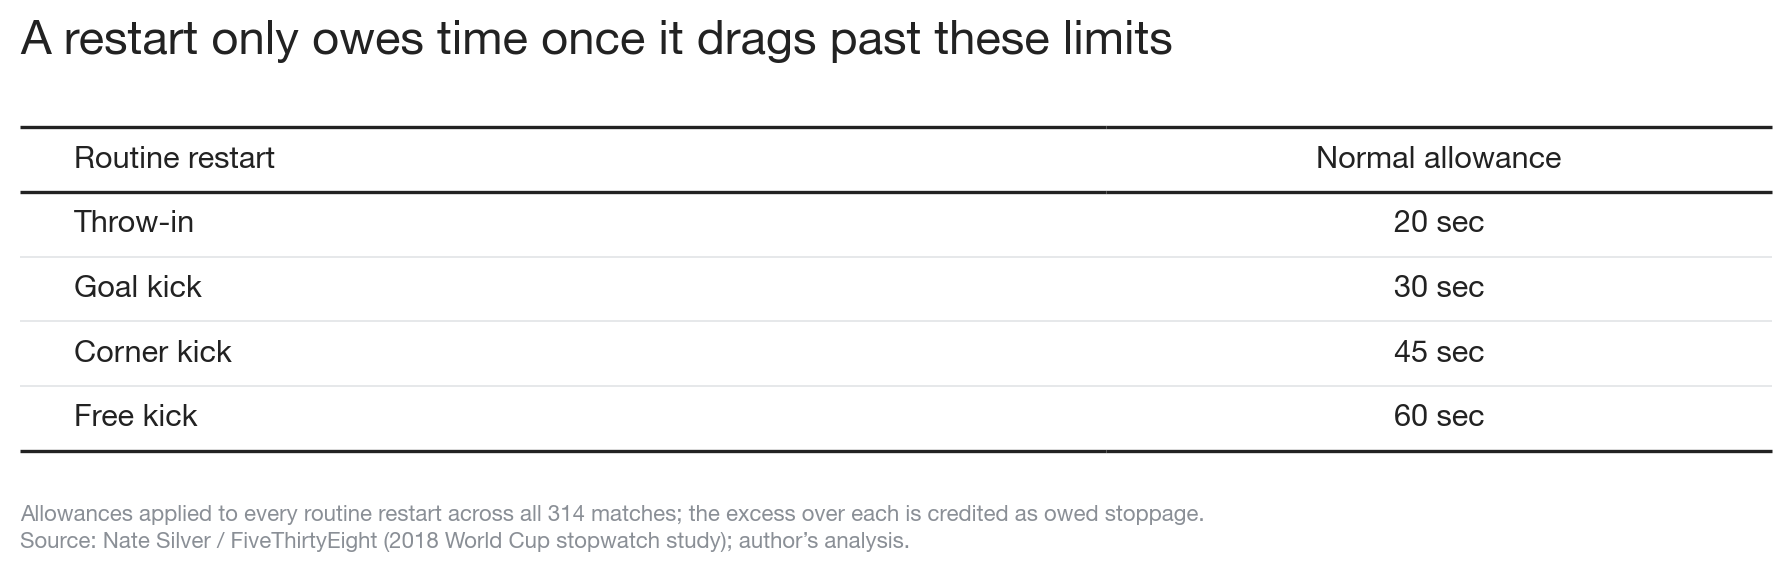
A throw-in that takes 50 seconds owes 30; one that takes 15 owes nothing. Genuine stoppages (celebrations, subs, cards, injuries) are credited separately.
I calibrate the estimator against the one independent ground truth that exists: Nate Silver’s by-hand measurement of all 32 World Cup 2018 matches, where he recorded both the stoppage that should have been added and the stoppage that was.
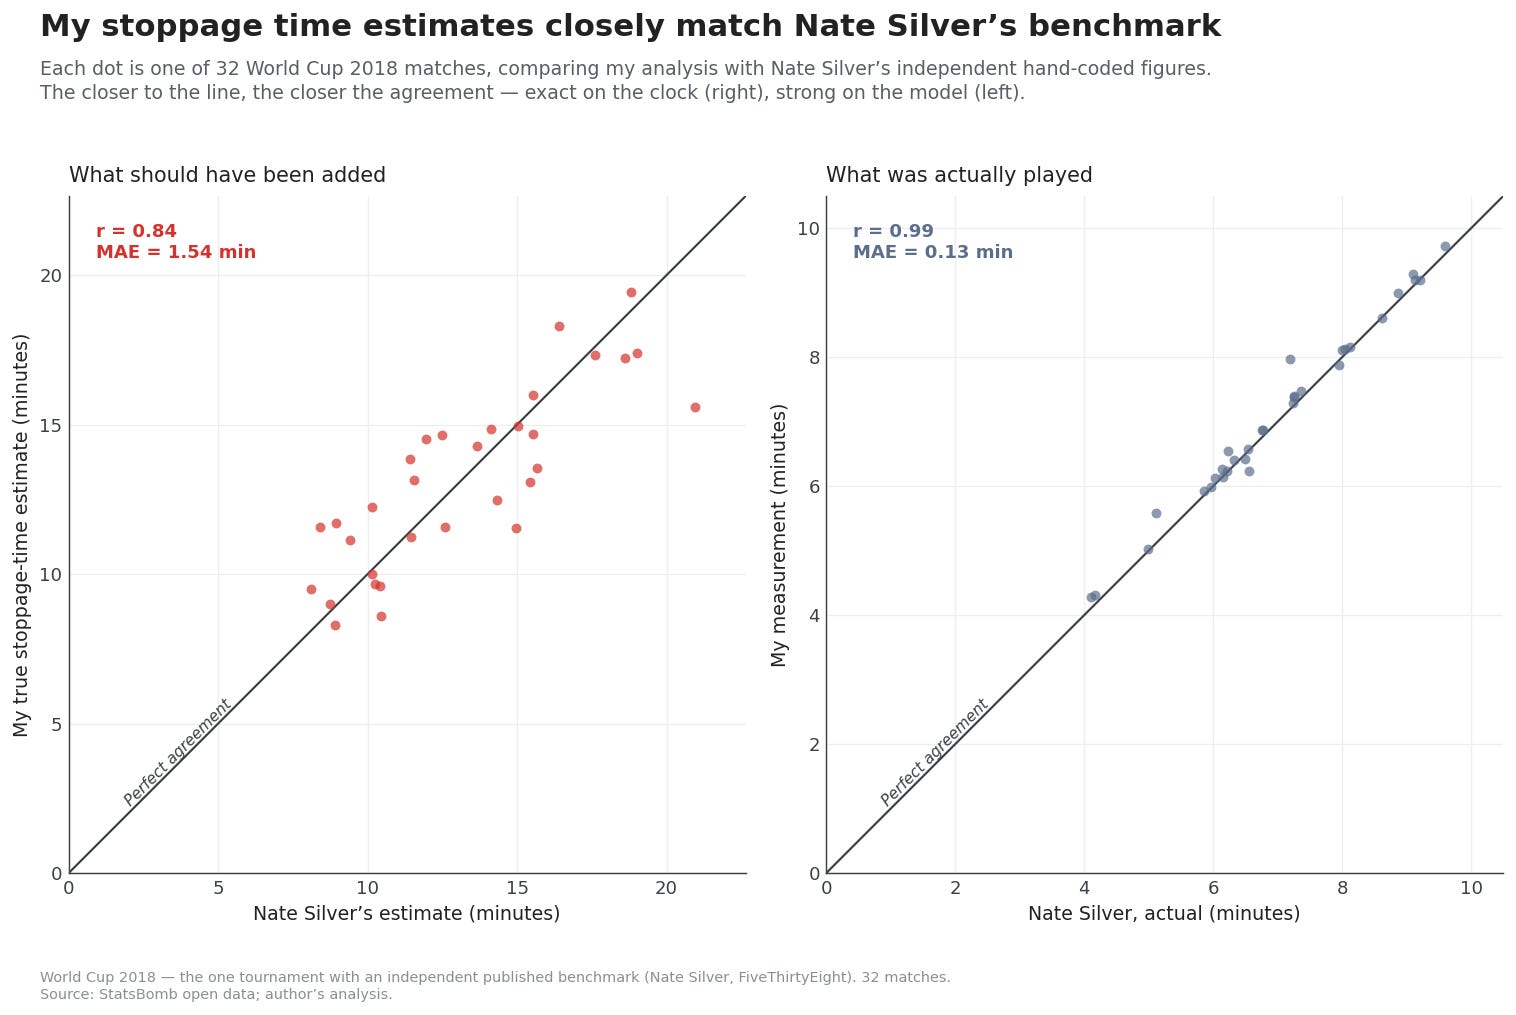
Stoppage played is the easy half — whistle-to-whistle added time, read straight off the event clock — and my played clock matches his almost exactly (r = 0.992). That near-exact match is what makes the owed estimate believable: Nate, with a stopwatch and no access to this pipeline, found the same shortfall (r = 0.836, average error 1.54 minutes). Across the 314 matches, the owed stoppage average (mean) is 16.2 minutes and the omitted average is 7.3 minutes, positive in 98% of matches.
Important Context - Changes to the stoppage time rules in 2022: FIFA directed referees to count stoppages more honestly. The biggest change was to add all of a goal celebration to stoppage, rather than the perceived “excess” of one. (I update my stoppage time estimate for post-directive tournaments to count 100% of goal-celebration stoppage, rather than the ~25% I calibrated to Nate’s data.)
Step 2 — Reconstruct the live football, and check it against outside numbers. Dead time is the gap between two timestamps: a pass goes out of play, a throw-in is received, and the seconds in between are dead. Summed across a match, those gaps give ball-in-play. I validate it against the best external anchors there are. For the 2022 World Cup my reconstruction reads 57:40 against Opta’s 58:04 (−24s); for 2018, 56:00 against Opta’s 54:50 (+70s), with FiveThirtyEight’s 55:18 in between. (Opta, now Stats Perform, publishes the industry-standard ball-in-play figures.)
Some gaps have no restart to explain them: the ball goes out of play, then a pass arrives, with no throw-in logged in between. The matches are coded by hand off the broadcast feed, so silent gaps open for all sorts of reasons: the camera cuts away from the pitch, the human coder takes a bite of a sandwich, who knows. I set one global threshold for how long such a gap must run before the ball counts as dead. Sweeping it from 12 to 30 seconds is the ±1 minute of per-match uncertainty I carry, rather than a false-precision point. The headline moves by less than 0.1 percentage points across that whole range, because the live-football level enters the final number twice — once in the scoring rate, once in the exposure — and the two largely cancel.
Step 3 — Calculate the probability of a goal in the missing minutes. Each omitted live minute is assigned a goal rate. Expected extra goals is rate times minutes, and the chance of at least one extra goal follows from the Poisson formula. Start with the simplest version:
μ  =  (goal rate) × (omitted live minutes)
P(≥1 extra goal)  =  1 − e^(−μ)
Headline  =  average of P across the 314 matches
Three terms need defining, and that is the whole model.
1. Omitted live minutes. Owed minus played gives omitted clock. Scoring differs by half, so the window splits into 1st and 2nd half:
μ = λ₁ · ℓ₁ + λ₂ · ℓ₂where λ_h is goals per live minute in half h and ℓ_h is the omitted live minutes in that half.
2. The live share. An omitted minute is assumed to look like the average minute of that same half — its regulation play plus the added time that was actually played — not like the few, unusually dead minutes of stoppage the referee did add. That same reference period also sets how much of the re-added time would itself be wasted: referees would have to top up for stoppage within the stoppage, but only the genuine-stoppage share of dead time recurs, not ordinary dead-ball flow. Anchoring both to a 45-minute base, on the teams playing that day, beats reading them off the handful of skewed minutes that happened to be played.
3. The goal scoring rate. λ₁ is the 1st half stoppage rate, held fixed. λ₂ starts at the observed 2nd half stoppage rate and decays toward the open-play floor across the window. Putting it together, per match:
ℓ_h  =  max(0, owed_h − played_h) × (same-half live share) × (in-stoppage gross-up)
μ    =  λ₁ · ℓ₁  +  (decayed λ₂) · ℓ₂
P    =  1 − e^(−μ)
Headline  =  mean of P over 314 matches
Why the decay? See Objection 1.
Objections
Objection 1: If we add more time, teams won’t keep scoring at the same rate.
True, and the model is built around it. Scoring is not even across a match: it climbs, and 2nd half stoppage is the most productive window on the field.

That peak is 1.9× the open-play rate. The minutes observed at 0.0816 are selected for desperation, so pricing fresh, neutral minutes there would overstate the result.
So the rate decays. No omitted 2nd half minute is priced at the raw peak. Each is priced on a curve falling from 0.0816 toward the open-play floor of 0.0427, with a half-life swept from 2 to 8 minutes (central 4). The longer the hypothetical window, the closer its minutes are priced to ordinary open play.
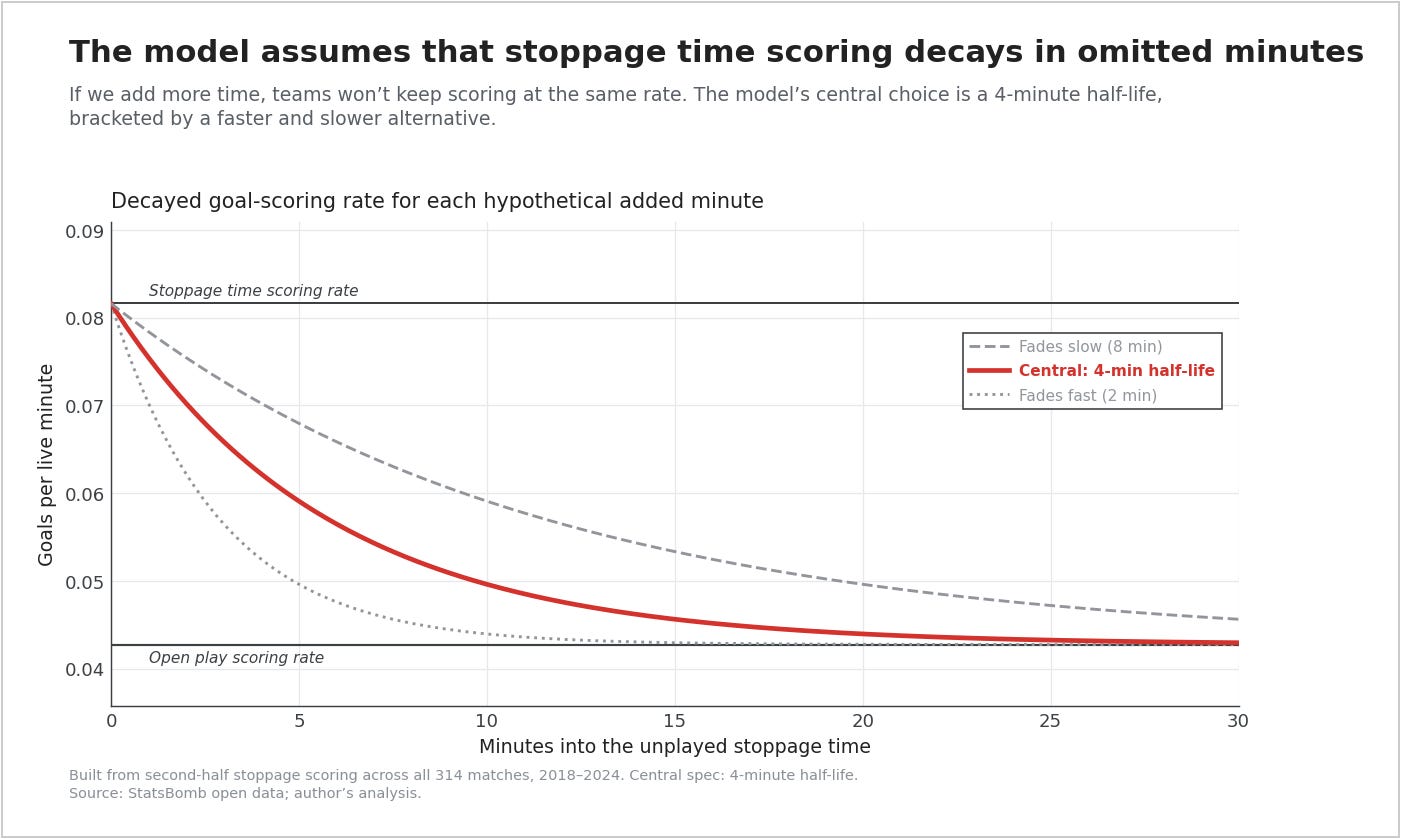
The whole decay band runs from 20.2% (fastest decay) to 22.4% (slowest), under three points around the 21.4% headline.
Important context — a natural experiment in doubling added time. When the 2022 directive roughly doubled second-half stoppage, the per-minute scoring rate declined modestly: 0.089 PRE (37 goals / 415 live-minutes) to 0.075 POST (36 / 479). Being in stoppage looks genuinely different from ordinary football with the clock still running — the urgency it manufactures wouldn’t exist in a stopped-clock version of the match — so pricing those minutes down toward open play, as the decay does, is probably conservative. One confound cuts the other way: POST teams wasted more regulation time once they learned it would be topped up, so more of each match slid past 90 into stoppage, and part of the premium is just “late minutes of a shortened game.” Either way, the model prices both urgency and selection down toward open play, and the answer barely moves.
Objection 2: The high rate is just trailing teams chasing a level scoreline. When a side trails late it throws bodies forward, so maybe the premium is only desperate, level matches.
2nd half stoppage scores at about the same rate whether the game is level at 90 (0.0886 [0.0567, 0.1318]) or not (0.0786 [0.0581, 0.1039]), with heavily overlapping intervals. Conditioning the entire model on score state at 90 barely moves the headline, from 21.4% to 21.0%.
Objection 3: The high rate is a knockout-stage effect. Maybe the late rate is inflated by win-or-go-home stakes.
Split the same window by match type: group stage 0.0847 (56 goals / 660.8 live-minutes) against elimination 0.0727 (17 goals / 233.7 live-minutes), the point estimate actually leans *higher* in the group stage (rate ratio 1.17, binomial p = 0.69). There is no separate elimination effect to price into the model. Carried all the way through: source every match’s rate from the group stage alone and the headline lands at 22.5%; from the knockouts alone, 18.2% — both inside the envelope, with the all-matches central at 21.4% (the sensitivity table shows this as the knockout-vs-group row).
Objection 4: The flipped result estimate assumes a goal is equally likely to fall to either team, but the trailing team scores more often. When a team leads by one at 90, the result flips only if the trailing side scores, and the chasing team scores more often than the leader, so a flat 50/50 split should understate flips.
The model does split omitted-time goals 50/50. Measured in the data, the trailing team takes 0.548 of the goals scored in lead-by-one stoppage situations (n = 31, 95% CI [0.375, 0.713]). Sweeping that split across the whole plausible range, 0.40 to 0.60, moves the result figure only between 10.0% and 11.5%.
Objection 5: The flipped result estimate assumes a goal is equally likely to fall to either team, but the the team leading by one at 90 is usually the stronger side, so an even goal split should overstate flips. This is the mirror image of Objection 4: if the team ahead is the better team (which we would expect on average), the trailing side should convert fewer than half of the omitted-time goals.
First, let’s set the stakes: the predicted flip rate (10.8%) decomposes into tied matches (6.7%) and lead-by-one matches (4.1%). This objection touches second group.
Within the 121 lead-by-one matches, the objection still falls flat. I pulled pre-match World Football Elo rankings for all 314 matches: in lead-by-one situations the leader is the stronger side 60% of the time. The average Elo gap is 38, because the lead-by-one subset already filters many of the lopsided mismatches this objection imagines (95 of the 314 matches are lead-by-2+ at 90, and therefore unflippable). Team quality genuinely predicts who scores next — a logistic fit on the Elo gap is significant — but the trailing team’s *late chase* outweighs that *team quality* edge until the leader is about 146 Elo stronger, a bar only 39 of the 121 matches (32%) clear. So the trailing side still takes more than half the goals: 55% in 2nd half stoppage time (n = 31), and 51% at any minute of lead-by-one matches (n = 287). Re-pricing every match’s split by its own quality-conditioned trailing-share moves the result figure by at most 0.44 points, to between 10.8% and 11.2% — inside the [9.1%, 12.8%] interval.
Results and sensitivity
Two kinds of uncertainty, kept apart. Sampling uncertainty is the bootstrap CI [20.1%, 27.3%] (width 6.9 points): over 1,000 draws, each goal-rate cell is redrawn from a Jeffreys–Gamma posterior and a shared owed-stoppage estimator error is split across the two halves. Specification uncertainty is how the headline moves as defensible modeling choices change, one at a time (the 20.2–25.6% band) or all jointly (the 17.3–27.0% envelope).
Two kinds of uncertainty, kept apart. Sampling uncertainty is the bootstrap CI [18.2%, 25.2%] (width 7.0 points): over 1,000 draws, each goal-rate cell is redrawn from a Jeffreys–Gamma posterior and a shared owed-stoppage estimator error is split across the two halves. Specification uncertainty is how the headline moves as defensible modeling choices change, one at a time (the 19.2–23.7% band) or all jointly (the 16.3–24.9% envelope).
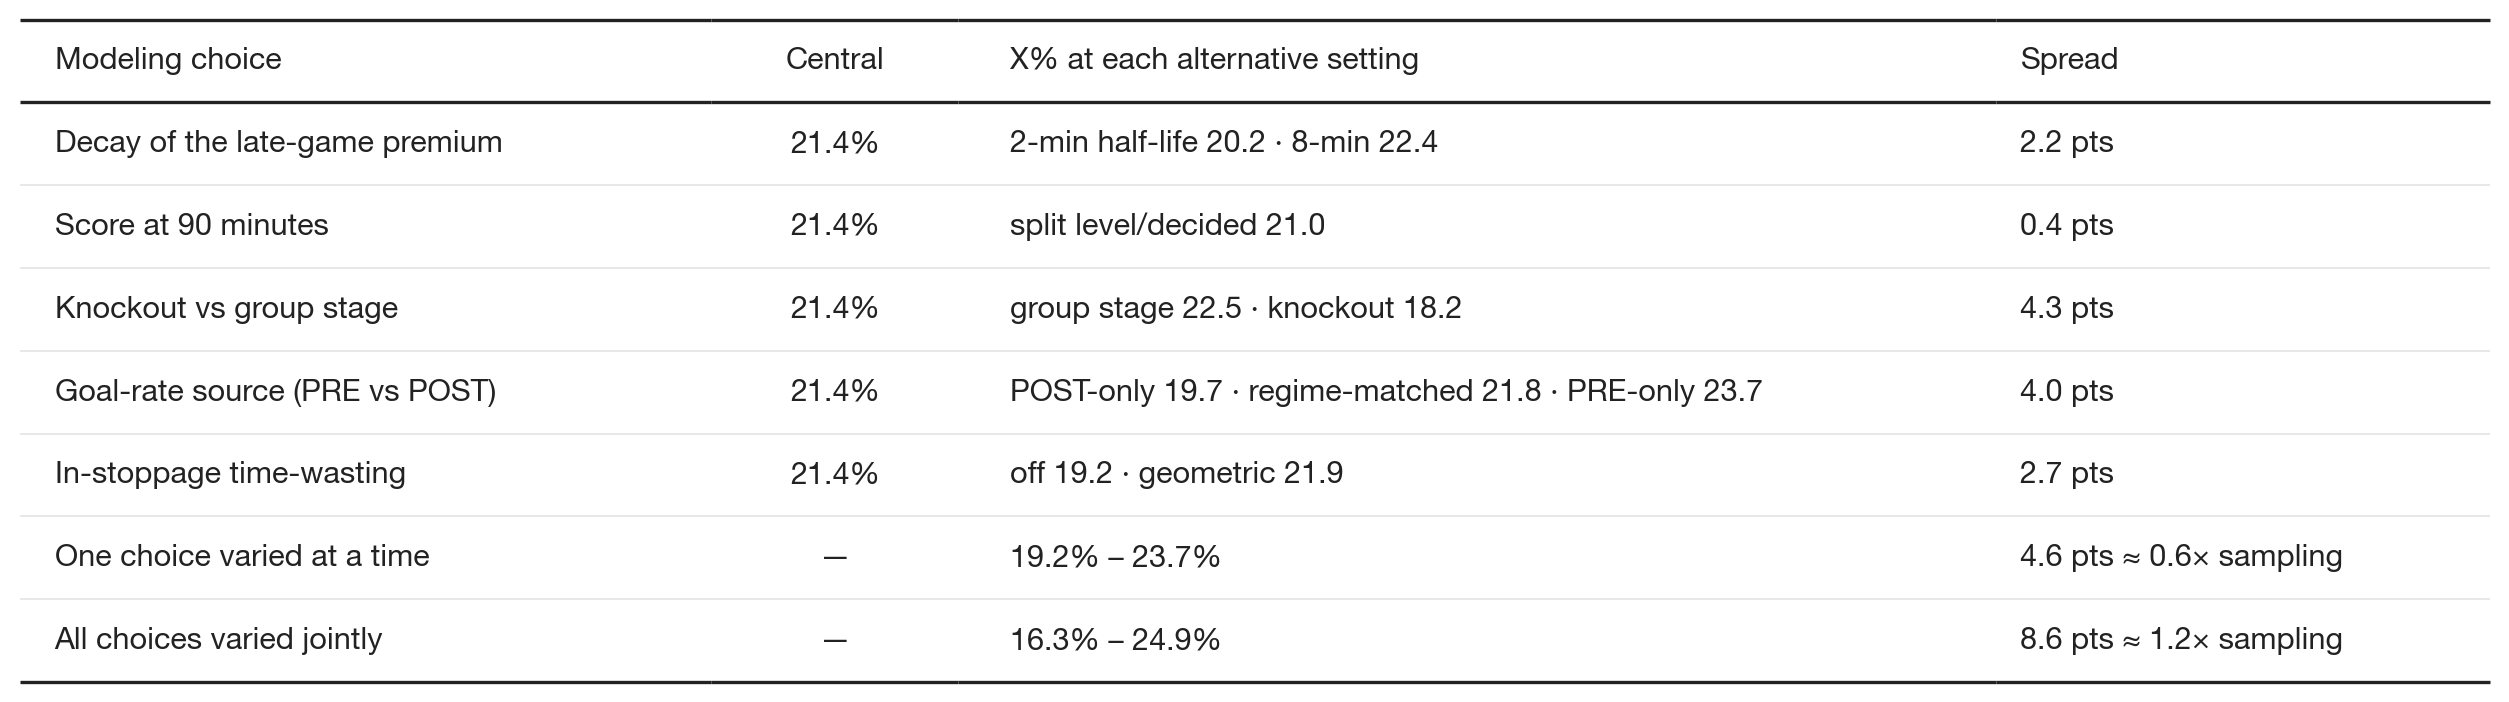
The one-at-a-time band (4.5 pts) is below the sampling CI (7.0 pts), and the joint envelope (8.6 pts) only modestly exceeds it. The headline does not hinge on any single knob. The PRE-only λ source sets the top of the band at 23.7%, on a thin, wide-interval PRE sample; the central pooled rate is the one to read. Sourcing every match’s rate from one stage moves the headline modestly either way — 22.5% from the group stage, 18.2% from the knockouts — and both stay inside the envelope.
Flip mechanics: the model splits omitted-time goals 50/50 between the two teams (Objections 4 & 5) and treats any match leading by two or more at 90 as unflippable. 95 of the 314 matches were already decided by two or more goals at 90, so they cannot flip at all.
Limitations
To state the obvious, this is a counterfactual model. While the assumptions are grounded in evidence, the output is unfalsifiable. I don’t have external data to test against, because no one has ever played the stoppage time that did not get played.
The calibration that anchors the entire model — the owed-stoppage estimator in Step 1 — is fit on World Cup 2018 only. That’s the lone tournament where an independent observer measured the truth by hand. The residual term this calibration produces is then frozen and applied unchanged to the other five tournaments. This application crosses the 2022 stoppage time policy change, when owed stoppage time jumped from 13 minutes (2018 World Cup) to roughly 19 minutes. While my mechanics for estimating owed stoppage time update to reflect the policy change (e.g., by capturing the full time spent on celebrating goals, rather than the excess), the estimate cannot be validated externally. (P.S. If someone wants to grab a stopwatch and hand-measure dozens of post policy change matches, let me know.)
The scoring model is Poisson, which treats goals as independent draws at a fixed per-minute rate. Football goals are not independent. A goal changes tactics, momentum, and scoreline pressure, so the rate for the next goal is conditional on what just happened. Poisson is the standard first pass for a rate-times-exposure question like this one, and the scoreline estimate needs only the total expected goals in the omitted window, which it captures reasonably well. A fuller treatment (Bayesian, with state-dependent rates) could model more complex conditional dynamics.
The result figure asks more of that model than the scoreline does, so I report it separately. Flipping a scoreline needs one more goal by either side. Changing a result requires knowing which side scores it, which requires a per-match estimate of each team’s scoring probability that this model does not build. Objections 4 and 5 discuss how much that gap matters. The 10.8% flip splits into 6.7 points from matches level at 90, where any goal flips the result no matter who scores, and 4.1 points from one-goal games, where team quality decides. Only that second slice is sensitive to a better per-team model. I tested the 4.1-point slice directly (ADR 34): swapping the flat 50/50 split for a per-match, Elo-conditioned one moves the result figure by at most 0.4 points. So I believe a more sophisticated model would leave the aggregate flip result close to 11%.
The six tournaments are pooled but not identical. For instance, owed stoppage runs higher in Copa América 2024 (20.4 min) and AFCON 2023 (21.9) than in the Euros (about 14). But the model pools only one thing across them: the stoppage time goals-per-live-minute rate, applied to each match’s own omitted minutes. Re-sourcing it from PRE-only, POST-only, or regime-matched cohorts keeps the headline inside its band. Truth is, I pool the six because I need the sample. Given a choice between widening the regional pool (Copa, AFCON) and widening the time horizon (pre-2018), I expect the regional pool to produce the more accurate model, because football varies less across space than across time. For example, the national squads all draw overwhelmingly from the same club leagues, so the region now marks a federation more than a style. (For what it’s worth, the mean pre-match Elo gap between opponents runs 157 to 203 across all six tournaments, a spread under 50 Elo. AFCON differs on absolute strength, its teams averaging about 300 lower, but the relative gaps are stable.)
Finally, the model does not condition on the match-specific factors that shape real added time: substitutions and positional changes, player fitness and injuries, bench strength, weather, pitch condition, etc. Those belong to a match-by-match prediction. The headline is an average over 314 matches, where such factors enter the observed scoring rates in aggregate but are never modeled one match at a time.
Reflections
The failure to measure stoppage time corrupts the sports for two reasons. First, it rewards time-wasting. Second, and more importantly, it short-changes the minutes that flip match outcomes.
Significance to the 2026 World Cup. We are in the middle of a tournament, which makes this project as much a measurement exercise as a live indictment of the referee. Some thoughts:
The errors that arise from under-awarded stoppage time compound over the course of a tournament. How many group stage matches would’ve been decided differently? And therefore how much of the elimination bracket was “wrong”? And so on…By the time we reach the final, we have two teams standing on a stack of errors. In many cases, the team that lifts the trophy is correct. However, the bracket that delivers the result is certainly not.
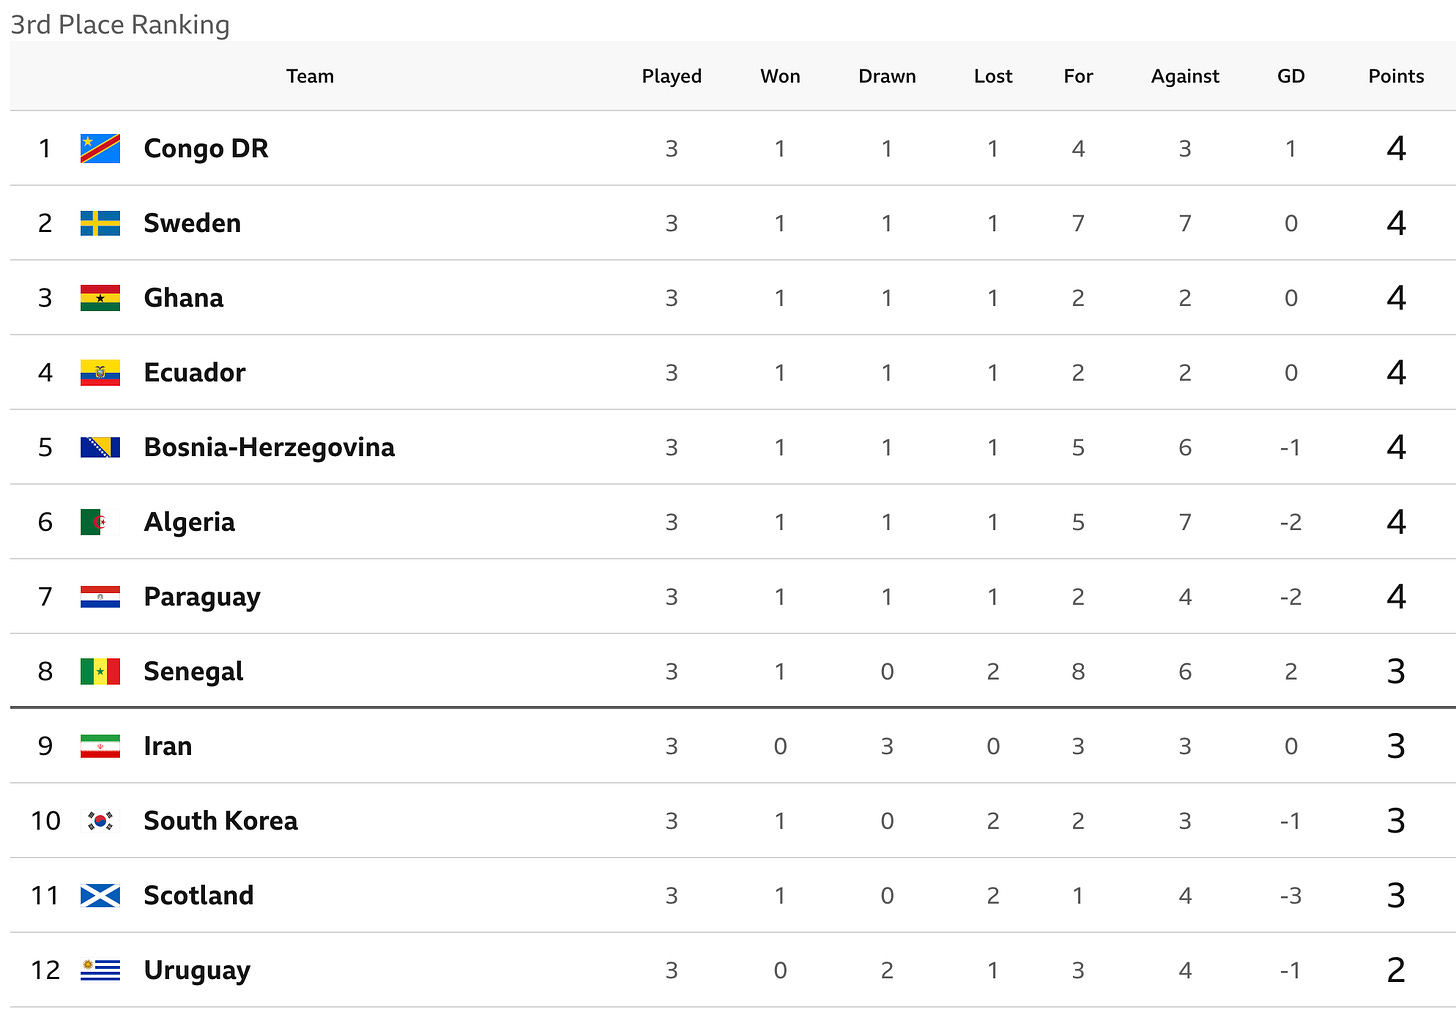
The new tournament structure means that more teams than ever advance (or not) on goal difference, which amplifies the failure. Take a look at the group stage third-place rankings below, which decided who progressed into the knockout round. Recall that 1 in 5 scorelines change when stoppage time is awarded correctly.
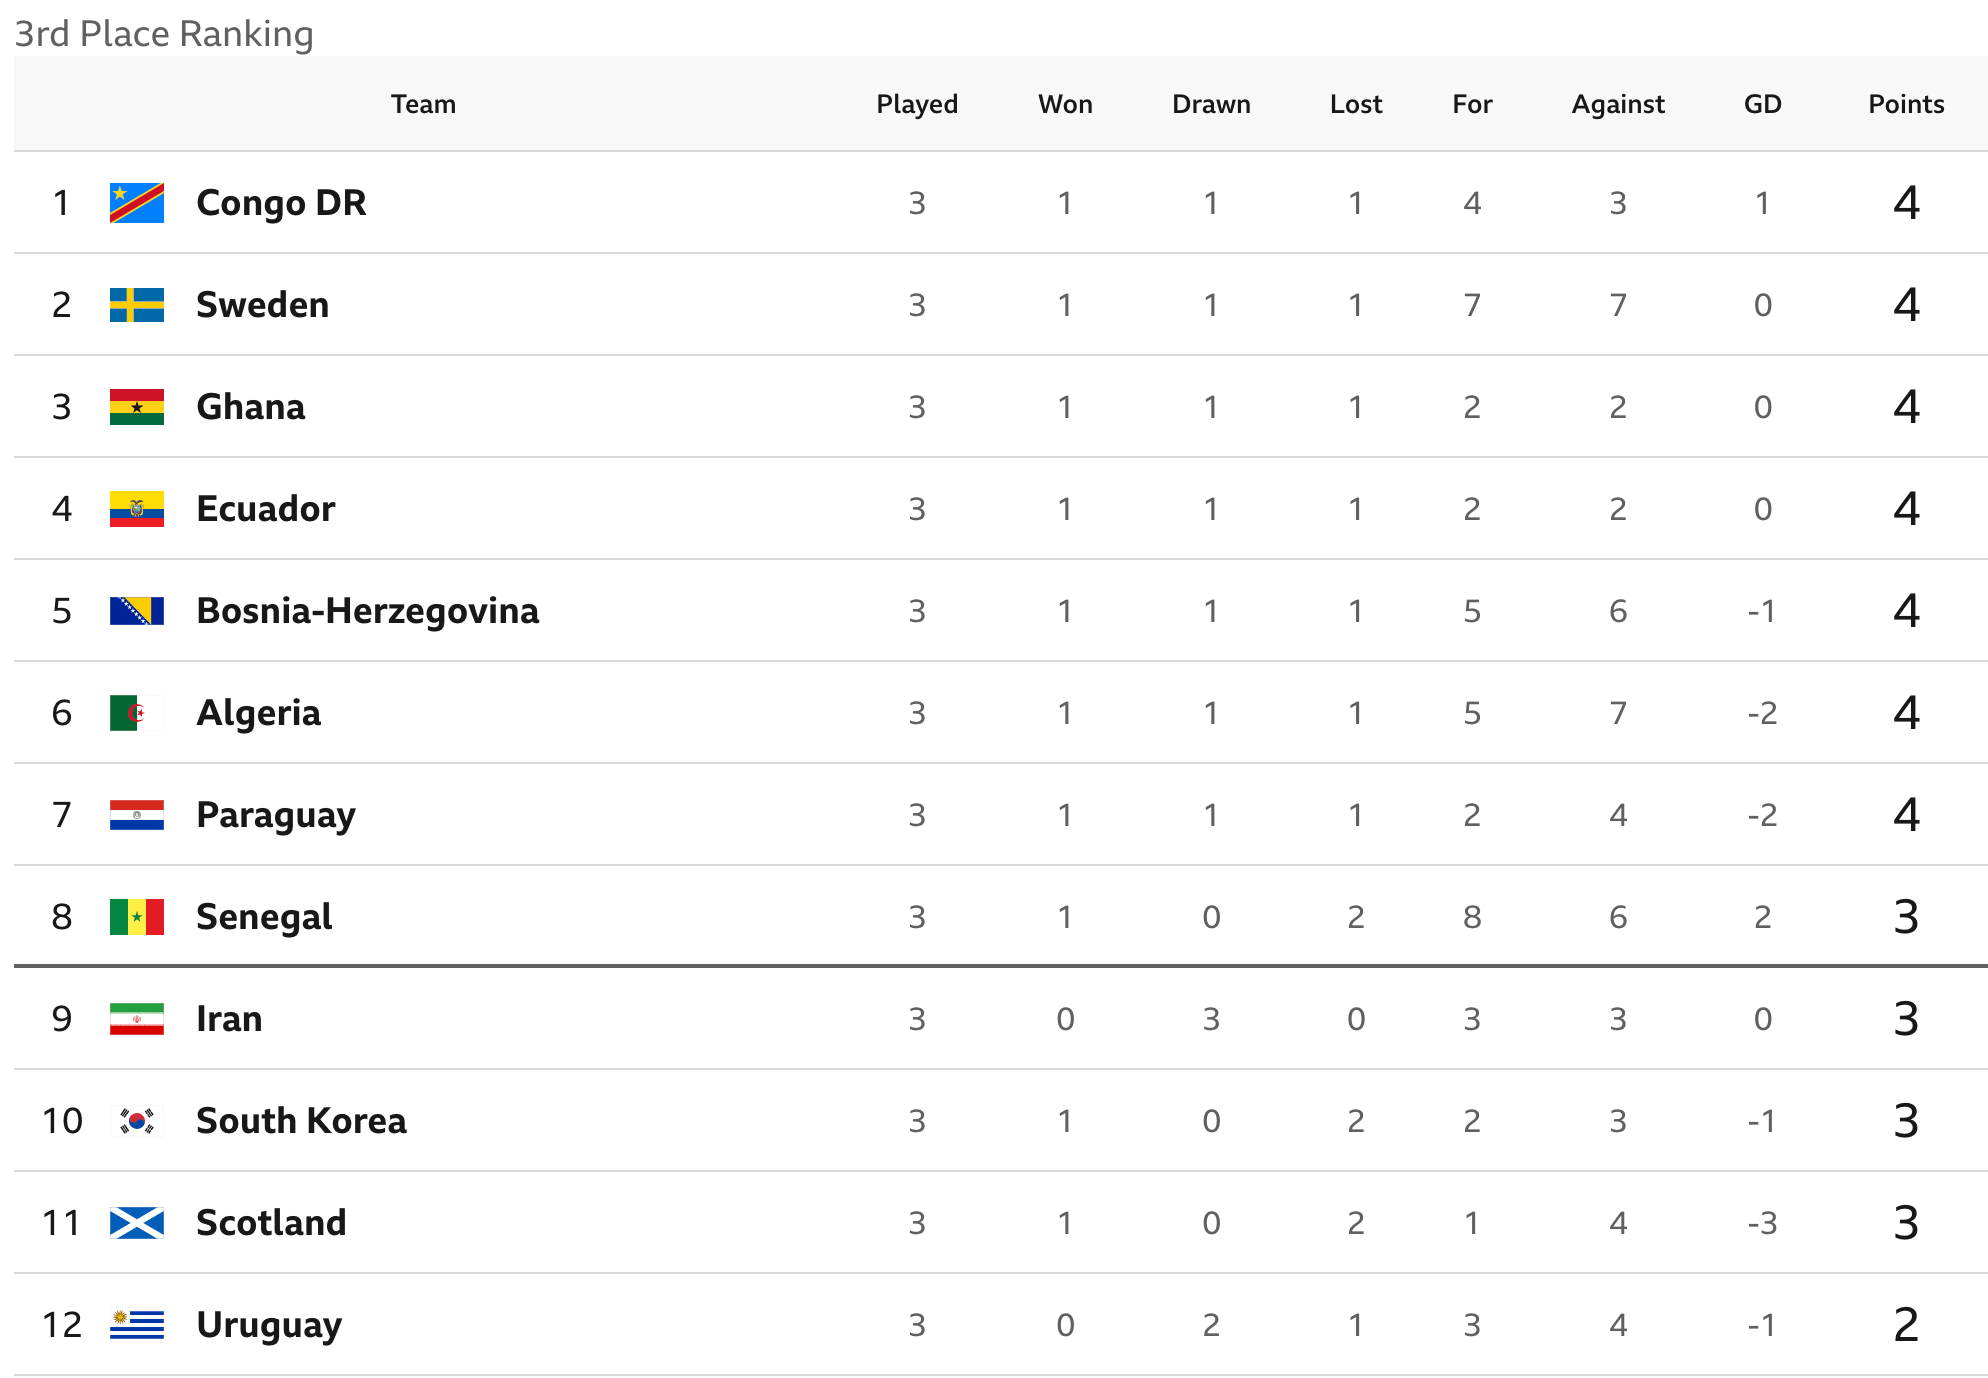
Is the current fix working? Remember all that stoppage time in Qatar? As noted earlier, it happened because FIFA’s head referee, Pierluigi Collina, released a directive that instructed refs to add time more fully. The problem was: its main effect was to produce more time-wasting. (We know this because the amount of time the ball was in play actually declined, despite match length increasing 3.2 minutes.) So, Collina reversed course for 2026, implementing countdowns for throw-ins and goal-kicks, among other measures. Early signs are cautiously positive (less overt time wasting, more ball in play), but I do not have access to live data to make an informed judgement.
What do the people want? This is the part no amount of measurement settles: from my anecdotal experience, many fans don’t want these minutes anyway. During Qatar, they were not annoyed that more of the clock was being wasted; they were annoyed by the extent of the stoppage time itself. (This is a version of “the game is gone” complaint, where “the game” is some notional 1 to 3 minutes that are tacked onto each half, no matter how much time is actually wasted.)
So let me put it in the plainest terms. An extra five minutes may sound small, especially when 30% is typically lost to non-addable dead time. But at the rate teams actually score in 2nd half stoppage (0.082 goals per live minute), five clock minutes is worth over one fourth of a goal. Even at the ordinary open-play rate (0.043), it is worth over one eighth. High-variance events (i.e., goals) change tournaments, and the minutes most likely to produce goals are precisely the minutes most reliably left off the clock. To anyone who shrugs that it is only a few minutes: this is the point you are missing.
The full pipeline, reproducible end to end, is on my GitHub.
Updated since initial publication: I reclassified Euro 2024 as pre-directive (UEFA opted out of the 2022 directive) and corrected an injury-window over-credit. The headline moved from 24.8% to 21.4% (result-flip 13.0% to 10.8%), both downward and inside the original uncertainty band.
Great analysis. Thank you for sharing!
Some notes on objections:
on 2) In uneven match-ups, it's often the stronger team, that pushes for a win and wants to avoid extra-time. So controlling aginst draws doesn't proove, the lift up comes from all-or-nothing-tactics. On contrary: What would explain the statistical overweight, if not a significant shift in play dynamics?
on 3) The control against group stage matches isn't valid as a fair share of them has more urgency than knock-out stage games: 1 There is only three games, they become "knoc-outish" quite fast and often. 2 There is no extra-time, which emphasizes the urgency to resolve the game in stoppage time.
Interesting, thanks for sharing. My mental model has always been that teams increase risk taking the closer it gets to final whistle, so scoring rate goes up (either scoring or conceding on counter as result of trying to score) as this point gets closer. But perhaps this is just a symmetric version of your decay (rising rather than falling) so in reality doesn’t make too much difference?